
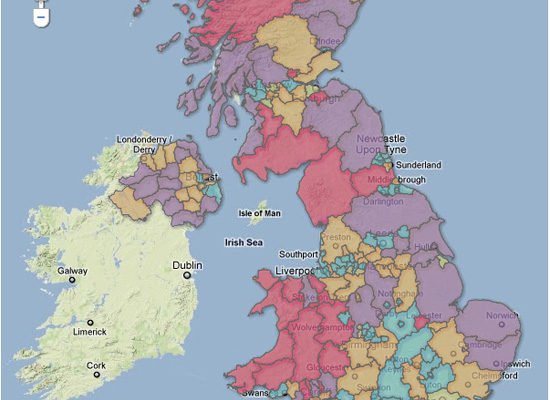
Click on the map or here to view Ofcom’s broadband map.
Ofcom has released an interactive map of “Broadband Britain”, which will help the Government identify notspots in need of investment.
The broadband speeds map ranks each region on a number of factors, including average sync speed, availability of “superfast” broadband lines, and percentage of lines with speeds slower than 2Mbits/sec – the speed that the Government aims to provide to all British households by 2015.
Fermanagh in Northern Ireland is the region with the slowest sync speed, averaging only 4.3Mbits/sec. At the other end of the scale, Endinburgh is the UK’s fastest broadband region, clocking an average sync speed of 10.1Mbits/sec – although in both cases actual throughput will be markedly slower than the sync speed.
Northern Ireland once again comes off poorest when it comes to the percentage of lines capable of achieving 2Mbits/sec. More than a third of the lines (35.9%) in Cookstown have a sync speed slower than the Government’s target. In fact, nine of the top ten regions with the highest percentage of sub-2Mbits/sec lines are from Northern Ireland.
Edinburgh has the highest percentage of 2Mbits/sec+ lines, although even the Scottish capital has 4.5% of its population on sub-2Mbits/sec connections, revealing how much work the Government has to do to achieve its stated target.
Meanwhile, Newtonabbey in Belfast and Luton in Bedfordshire are the only two places in Britain with 100% superfast (24Mbits/sec+) broadband availability, according to Ofcom’s figures.
On the flip side, no fewer than 33 regions in the UK have no access to superfast broadband, the majority of which are from Scotland and Wales, including cities such as Aberdeen.
Ofcom has made the data behind the map available for download from the broadband speeds website.
via PC Pro
Comments