
These epic infographics are really interesting and at the same beautiful.
Wow ancient people got around a lot.
An introduction taken from the site.
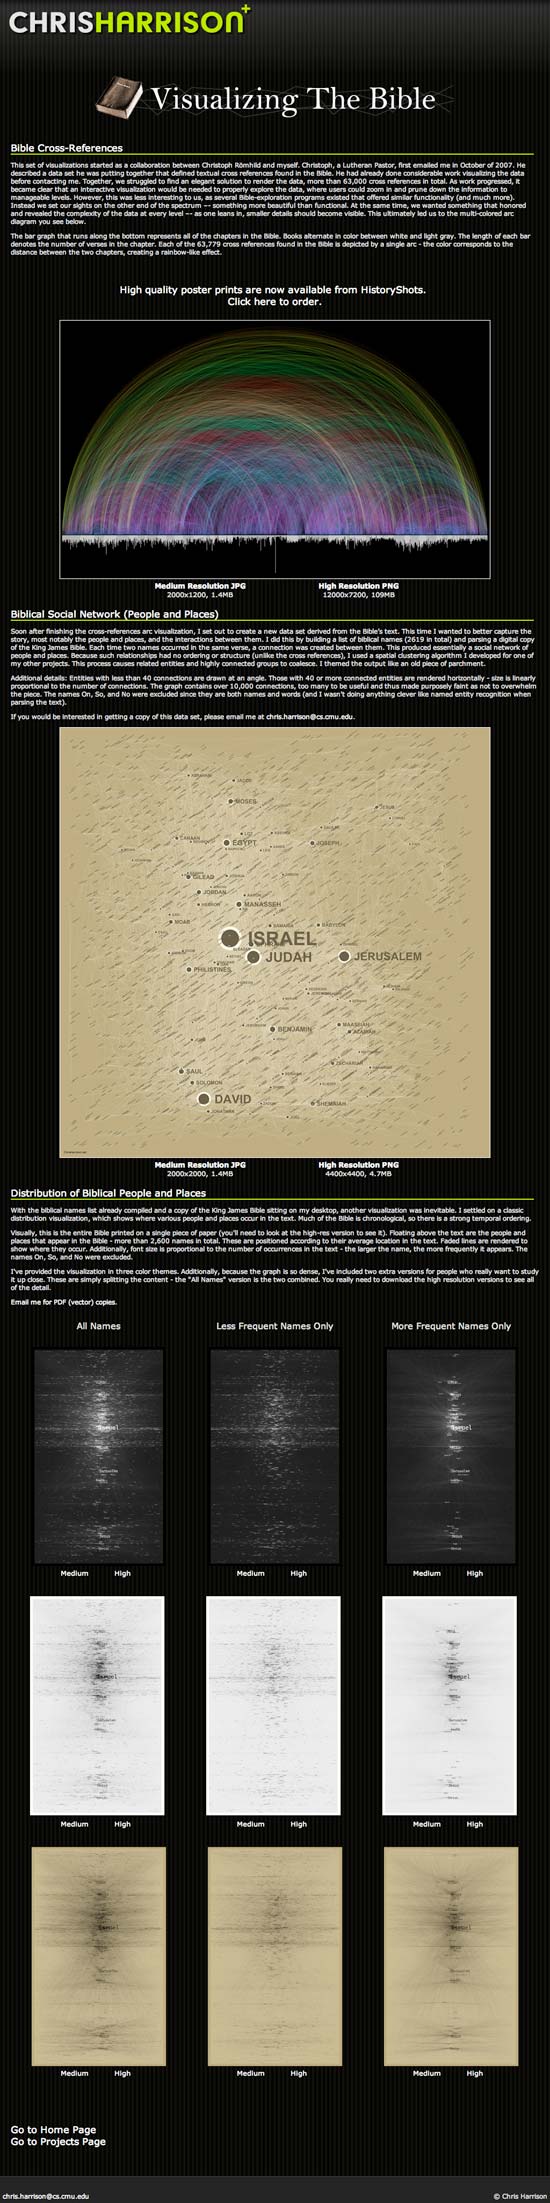
This set of visualizations started as a collaboration between Christoph Römhild and myself. Christoph, a Lutheran Pastor, first emailed me in October of 2007. He described a data set he was putting together that defined textual cross references found in the Bible. He had already done considerable work visualizing the data before contacting me. Together, we struggled to find an elegant solution to render the data, more than 63,000 cross references in total. As work progressed, it became clear that an interactive visualization would be needed to properly explore the data, where users could zoom in and prune down the information to manageable levels. However, this was less interesting to us, as several Bible-exploration programs existed that offered similar functionality (and much more). Instead we set our sights on the other end of the spectrum –- something more beautiful than functional. At the same time, we wanted something that honored and revealed the complexity of the data at every level –- as one leans in, smaller details should become visible. This ultimately led us to the multi-colored arc diagram you see below.
Comments